Squares
Categories: Geography General, Industry
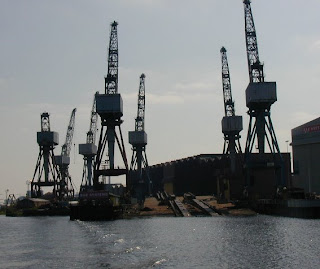
I was thinking of trotting out the usual whiteboard exercise on mapping Industry tomorrow, using a selection of scanned maps to show old/new industrial landscapes. This tends to work OK, but I've always felt that it's a lesson which ends quite abruptly. It's always the last lesson of the unit for me, and we race through it, check once and move on, only revisiting for revision. When I was trying to prepare my maps today, I thought about using some photos to drag and drop on the map to make this a bit different. It was then I thought for the first time about using Geograph for O.S. map revision. Take the picture above for instance. This is a well know part of Glasgow's skyline, and an image many of you have probably at some point seen. If I asked you to find it on a map, some of you might even have a rough idea of where it is. If, however, you were not natives of this part of the world, it would probably be hard for you to associate the map with the image. Geograph lets you do precisely that by using the Ordnance Survey's Grid. You can pick any location on the map, focus in until you have the same grid as the map you are using and see photographs from that area, letting you understand what the map extract would really look like. Not only this, but iof you don't have the O.S. map with you, each picture has a little extract at the foot of the page. This is not only useful for industry and human geography, but excellent for physical, particularly for those crashing the Higher who have little experience of mapwork. More useful site areas for the lower school at the games section and the imagine section too, helping you interpret grid squares and symbols. Thanks to Chris Gunns for the photo.
posted by Kenny O'Donnell @ 10:45 pm
![]()


0 Comments:
Post a Comment
<< Home