<body><script type="text/javascript"> function setAttributeOnload(object, attribute, val) { if(window.addEventListener) { window.addEventListener('load', function(){ object[attribute] = val; }, false); } else { window.attachEvent('onload', function(){ object[attribute] = val; }); } } </script> <div id="navbar-iframe-container"></div> <script type="text/javascript" src="https://apis.google.com/js/platform.js"></script> <script type="text/javascript"> gapi.load("gapi.iframes:gapi.iframes.style.bubble", function() { if (gapi.iframes && gapi.iframes.getContext) { gapi.iframes.getContext().openChild({ url: 'https://draft.blogger.com/navbar.g?targetBlogID\x3d23069377\x26blogName\x3dOdblog\x26publishMode\x3dPUBLISH_MODE_BLOGSPOT\x26navbarType\x3dBLUE\x26layoutType\x3dCLASSIC\x26searchRoot\x3dhttps://geodonn.blogspot.com/search\x26blogLocale\x3den_GB\x26v\x3d2\x26homepageUrl\x3dhttp://geodonn.blogspot.com/\x26vt\x3d8160912104340948054', where: document.getElementById("navbar-iframe-container"), id: "navbar-iframe" }); } }); </script>

Odblog

A weblog designed to share Geography resources with students and colleagues

Thursday, April 30, 2009

Swine Flu in the classroom (no, not in that way...)

Categories: s1 and s2, Geography General
With s1 today, I decided to take a break between topics and try to do something about the swine flu epidemic which has been in the news. I started the period with a photo from flickr blown up on the board:-

Many thanks to hmerinomx flickr user. Most of the kids knew straight away that the location was Mexico and that we would be talking about swine flu, so I decided to try a starter which would help us understand how flu spreads. I asked students first of all to turn to the person next to them and share what they knew, thought or had heard about swine flu. This took no time at all. They then had to pass this down their row to the front, and a person in the front desk had to report back to the rest of the class on the accumulated knowledge. This illustrated two things- that person to person was a very quick way to pass things on, without any contact needed, and that sometimes some things did not pass on well. There were inevitably some things which had been mentioned somewhere in the row which the spokesperson had forgotten or had not been told. This was quite good as one of the rows had already fed back that an estimated 40% of people could potentially contract the disease, so I wanted to illustrate that the probability of everyone catching swine flu was very remote. I further emphasised the point about the ease of which a flu virus could be passed by asking Miss MacKay to record incidences of people touching their mouths, nose or coughing/ sneezing during the activity. This led on to another discussion about how contagious this was. From this, we defined what was meant by a pandemic.


The next thing I wanted to ask students was 'Should we be afraid?'. I wanted to separate out media hype from reality. We used a great google map and mapped the countries which were showing cases or suspected cases of swine flu:-

View H1N1 Swine Flu in a larger map


We used this to also read a bit more about the extent to which the outbreaks had affected countries. In most cases the incidences had been caught quickly and were now being treated. I also wanted students to see how people perceived swine flu, so we used a live tweet map. I was a bit worried about using this, but I thought it was worth the risk and seemed to go down really well with the students. There was a mixture of jokes about swine flu and others who obviously had colds or flu symptoms fearing armageddon! Only a few of the tweets had any serious information about the virus. From this, we concluded that people had been panicked and others did not take the risk seriously enough. I spoke about the WHO and their alert levels round about this point.


I would have liked to have used this BBC map with multimedia resources to help us understand if this virus could be treated/ contained, but I wanted to make sure that we had time at the end for students to try to stem an imaginary flu outbreak through this game. This was very good for looking at the spatial spread of disease in a short time span. After going to bed last night thinking that the lesson was abit sketchy, I was very pleased with both the way the students engaged with the lesson and the way that the resources worked. I am sure some of these resources must have been bookmarked from sln and the google map is something I originally saw on Keir Clarke's blog, so many thanks to those who provided both information and inspiration for this.

Sunday, April 26, 2009

Pepsi Challenge reworked

Categories: s1 and s2
Since last Thursday's flashmeeting, I have been thinking about how I could use QR codes. I had originally thought of using them in the fieldwork that s2 did recently, but started to question whether I would be using them for the sake of it. I've concluded that they could be useful for a number of reasons. 1) A class could potentially store a lot of information within one- a wiki page about a project, for example- which could be displayed at a target audience (I'll come back to this), 2) It's something which will create curiosity, and hopefully therefore an interest in the work of a class, and 3) I think that classes themselves might like the idea that they are in on something that only they know about. I still like the idea of a geocaching activity for s1 and I might try this later in the rotation, but I thought for my first run out, I'd stick to s2.

The code above basically contains the learning objectives for tomorrow's lesson and beyond and was made using kaywa. I wanted to introduce the lesson by showing the QR image above and asking students if they knew what it was, or had seen it before. Maybe some will have seen it here:


I wanted to then ask why companies like pepsi were using these codes on their bottles, and hopefully demonstrate this in class by using the reader in my phone to take me to the pepsi site with all of the downloads they are offering. I want to stress the idea that this is a great way to condense and then easily access information. I'll then put it to students that potentially, every assignment that they hand in could be sent as a code, therefore saving paper. This is a good introduction into how much we use that we perhaps don't need to. Really, we are talking about an element of a students ecological footprint.

I'll then ask a student to have a go at using the reader to unlock the learning objectives. These are as follows:

1. What is an ecological footprint?

2.How big is my footprint?

3.How big is my class footprint?

4.How big is the schools footprint?

The class will have a general look at footprints through this quiz. This will also become an individual homework activity, as students will all need their individual footprint for some later work. This then takes care of 1, 2 and 3 on the list. So, where do the QR codes come in? Well, I think there is scope here for some more school based fieldwork. I'd like to approach PSHE teachers about pupils doing this with their form classes, interviewing some teaching staff and hopefully, the head teacher too re: the questions in this quiz. I would then be looking at students presenting back through a wiki page- this again would be homework and then displaying some of the results in QR codes at appropriate areas around then school e.g. for issues about recycling near bins, about power near light switches, food in the canteen and so on. The codes lend themselves perfectly to this type of instant access to lots of information. If students were feeling really brave, they might even want to speak at assemblies about what they have been doing, but I don't remember feeling too brave myself at 13 or 14, so we'll content ourselves with having a trial at this first :-) Finally, I loved this definition of a global footprint from a child:
'A footprint means pressing down and global means world, so 'global footprint' means pressing down on the world and we don't want to press too hard'


Saturday, April 25, 2009

Biosphere assessment work

Categories: Biosphere
This is a group exercise. The class were given post its and had to organise themselves around one of the three soil profiles we are studying. Students were then split again into smaller groups, and using the post its as a strating point, had to construct a profile from blank and then explain it. Please feel free to give feedback, I'll be doing this too.


Thursday, April 23, 2009

A brief one

Categories: Biosphere, Geography General
Just been involved in a flashmeeting tonight. A rather bizarre experience hearing and seeing yourself while you are talking to others online, but a really useful hour, and I look forward to more opportunities to have a chat with enthusiastic and inspiring colleagues. Teacher readers can check out the wiki page here (fm for flashmeet) and can watch the replay from there.
I thought with Higher, I would maybe reprise something that I did with sand dunes, but for soils this time. This topic so far has been heavy on my input and I would like to give more over to students. Here's the idea-Groups set up with a large A3 blank page on the desk. Each student on entering the class given a relevant part of a profile, but not which soil it belongs to. Students have to attach themselves to a profile, then construct this and explain it. I thought I might video the results and send them through cellspin to the blog, but this depends on time as I'd like to get on to sand dune succession, another offering form Val Vannet. I think it would maybe lead to a bit more thought being put into the responses as it's pretty instant in its online appearance. I'm sure s4 could do a variation of this activity with one of their topics for revision. Right, off to do more reports, down to 60 out of 120! :0(

Sunday, April 19, 2009

You're living all over me (Cue the Biosphere)


Categories: s1 and s2, Biosphere, Advanced Higher

It's hard to believe that the two week break is over so quickly, and tomorrow is straight back in with Higher, who are likely to be going at F1 speed through the Biosphere topic. There are some great resources courtesy of Val Vannet via LTS, and the posters are something which could be used by students nearer the exam. It is ironic that for a topic about the living layer of the earth, I sometimes struggle to bring this to life. Thought about digging a profile using something resembling a giant screw (I think it's called an Auger), but we'll see how the time goes.

With s1, I'm going to go straight on to prepping the favelas and with s2 a bit of follow up to our school grounds fieldwork. We have already had a general look at what we thought made an environment attractive and then completed some environmental quality surveys around the school grounds. I would like to follow this up by wordling the four surveyed areas and getting a mean score for each area too. I think we could then use street view and google earth/google maps to do a bit of virtual fieldwork, as I'd really like to see if the class could explain patterns across a city against their expectations. We'll then finish this section off with a homework later in the week based on the worst places in the world, but turning it on its head a little. I'd like the students to construct some positive arguments about these places, maybe using the kml file to place these.

Finally, Advanced Higher Study's-will need to look more at these tomorrow, but there is work to be done. I'd be hoping that there has been a fair bit of movement on this over Easter :-) Have some ideas that could maybe be used for presentation in some cases.

Friday, April 10, 2009

Cellspin in the field


Categories: Geography General
Today I trialled an application that I think could be brilliant for fieldwork. Cellspin is downloadable to a variety of mobile phones and basically allows me to send photos, text, video and audio directly to my blog, twitter, youtube and other social sites. On trial, evident in the previous posts which were authored in a car park at Inveruglas after a walk today, the pictures are more impressive than the standard blogger uploads as you get a larger image without having to play around with the html. The image (as with the one I uploaded) is also automatically rotated. The text appears nicely beneath the picture (although I couldn't title my post, at least, I don't think) as the entries are grouped by date, and I also managed to send a status update to twitter through it too. I'm thinking this would be a great way to record a trip using different media types- Videos for peer assessment, audio to analyse geographical description, text as a field logbook, 140 characters to summarise key features of a field location and photos to evaluate field sketches? I know not all students would be able to download this, but it would be nice to give a trial run to this in a real fieldwork situation soon. My only gripe would be that the application seems to stay open permanently. This might just be a phone bug or it might be me being tech incompetent!
I also had another go with everytrail for Ben Vane. I noticed that the trail was mostly accurate, but seemed to lose transmission about 100 metres from the summit, and also only recorded the trip one way despite me keeping the application running till we arrived back at our start point. I can't explain the summit, but I think the one way recording might be because we duplicated the path on the way down? I also geotagged my flickr photos, but they were all over the place. Tonight, I think I've worked out how to get my everytrail trips to accept the photos as they are taken, but unfortunately too late for today, so flickr snaps will have to do.
Ben Vane at EveryTrail

Map created by EveryTrail:GPS Geotagging
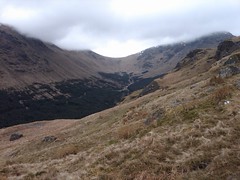
I also saved a couple of images from Google Earth for my walking buddy, and again was drawn to how excellent Gavin Brock's Ordnance Survey overlay for Google Earth can be for teaching maps. This picture of a corrie from our walk is the classic horsehoe or bowl shape:
Corrie from Ben Vane
To help students visualise this, all that's needed is the location in Google Eartha nd Gavins overlay. This could be such a big help to students, especially with exams approaching, for testing their map skills knowledge:


Uploaded by www.cellspin.net

Great day in the hills today. We decided to go to Ben Vane near Loch lomond. Bog at the start of the path made it hard going initially, but lt improved later. The summit was shrouded, but mapped the trip and got lots of photos which will upload to flickr later.

Thursday, April 09, 2009

Uploaded by www.cellspin.net

testing cellspin

Thursday, April 02, 2009

Park Life

Categories: Geography General
We are in quite a strange location for a school in that we are situated in a business park which holds the council offices, liesure centre, theatre, wedding and conference venue and a lot of parkland. As it was a beautiful spring day today, s2 took advantage of the weather to get out and about and use our extended school grounds to look at local environmental quality. Without having to go down the road of parental consents, we were able to walk a mile exactly and survey four very different locations. There are lots of potential uses of the school grounds and the eco-club has already done a litter study, and I liked David Rogers' idea of a micro climate study too. This is defintely something I'd like to explore a bit, and I think that the class appreciated getting out in the good weather and doing something out of the classroom environment. I mapped our walk using my phone and imported the pictures from flickr afterwards. Here's our walk, results hopefully to follow after the holidays:

school grounds at EveryTrail

Map created by EveryTrail:GPS Geotagging

Wednesday, April 01, 2009

In Arthur's Shadow, looking for freebies

Dynamic Earth and Arthur's Seat
Categories: s1 and s2, Geography General
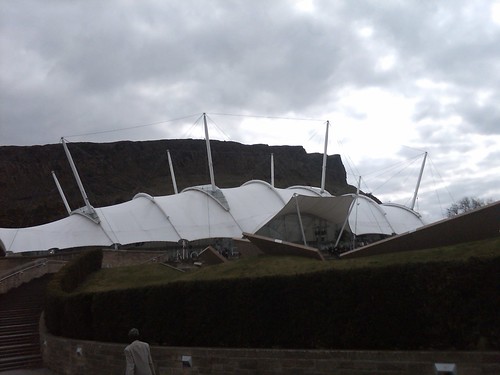
Had a nice day today, starting off in school and finishing in Edinburgh. Had to teach linear regression to Advanced Higher period 1 before a bit of a mad rush to the train station to get to Dynamic Earth. The reason for this was to take the opportunity to apply for a free seismometer for the school. Will have to sit down with Physics and others to draft a reason why we should be given one now, but given we already use Physics' help for showing different types of waves then I'm sure we could put something together. It was great to see some of the activities being proposed for use with the seismometer, firstly because some of them really whetted the appetite for putting together a proposal, but mostly because they could be adapted for lo-tech active experiments in the class. For example, there was a motorised earthquake table and this was shaking jelly cubes at different paces. When I saw this, it looked like something we could adapt to our own very basic shakers that s2 used this year to construct earthquake proof designs. I also saw audacity being used to show sound waves and how these could illustrate earthquake intensity with proximity to the surface. A really easy experiment with two mics, two audacity trails and then varying the distance of a handclap from the microphones. If the audio trail is spaced enough, the variation can be picked out quite clearly, and the beauty of this is that physics could use it to look at how sound travels too. It was also nice to meet colleagues old and new, and Val Adam and I had a chat about how she has been using Glow and about a potential collaboration when we are up and running. I have to say a large part of the enjoyment came from the journey. I don't often travel by train, but the journey to Edinburgh is long enough to sit back and clear the head a bit, and it was a beautiful day in the Capital, making the quite long wait for the train back less of a bind.
Two days to go (who's counting?) ;-) Tomorrow, the weather looks good, so I think we'll get s2 outdoors and doing a wee bit of local environmental quality surveys, while s1 could have a look at the intro to 'Favela Rising', posted by gazz on the sln forum (many thanks), followed by the now customary 'City of Men' clips. If I manage to find a decent image (maybe through piclits) it would be a nice idea to get some descriptive terms up on the board before we watch these and see if our perceptions change through the lesson.