Hydrographs, Hurricanes, Hay Bales and free calls...
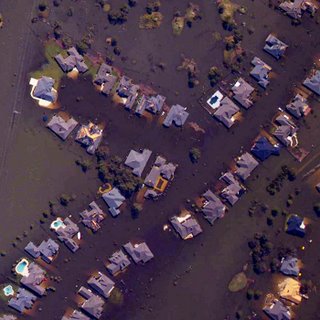
 New Orleans after Katrina
Categories: Rivers, Rural, s1 and s2, Environmental Hazards, Geography General
Following on from yesterday's post, I have created a storyboard for s4 to work on for their rural revsion movie. Had to limit it to the EMDC case study, as I felt that this alone might take a couple of periods. Will try it out tomorrow. have given the option of audio commentary and/or slide text. Higher are following on from the work we did on drainage basins yesterday. We had some good screenshots from the whiteboard, which I have miraculously managed to wipe, so I will try to recreate these, but using the GE image and then the map worked quite well for identifying the drainage basins and their watersheds. I was very pleased with the results of the brainstorming exercise on factors influencing channel flow using the Glen Croe slide, so I will again try to recreate this. We will take more of a look at the shape of drainage basins etc tomorrow, but will probably get on to Hydrographs. This is an area where some classes have previously struggled with the description element, so I am going to start, after a general introduction with this living graph from Russel Tarr, and will then put up a couple of hydrographs on the whiteboard with statements to drag to the appropriate graph. I had planned to give s3 a movie type activity, but after a restless period today, I feel a more calming activity would be beneficial! A little bit of field sketching perhaps...s1 are ready to move on to extreme waether and we will probably have a look at some New Orleans before and after pictures before using the New orleans video, which ironically forecast the disaster two years before it happened. Been experimenting with skype , which I think would be good for inter school links (free internet calls), but haven't quite worked out exactly how or who could use it yet.


0 Comments:
Post a Comment
<< Home